Make Data Driven Decisions for your Terminal
Table of Contents:
- Improved Data Visibility Supports Agile Decision Making
- Leveraging real-world challenges and customer feedback
- About OpsView and Analytics
Analyzing and managing your data well is the solution to keeping afloat in the bustling realm of terminal operations. Data needs integration and analysis, from the gate to the yard to the waterside. OpsView and Analytics helps supervisors and terminal leadership teams achieve faster, more effective shipping data analysis.
Improved Data Visibility Supports Agile Decision Making
OpsView delivers real-time visibility, turning scattered data into clear, actionable information with a range of dynamic dashboards. Analytics complements this by offering a deep dive into operational patterns with detailed KPIs, allowing you to spot trends and make informed decisions.
When combined, they not only help you swiftly address and resolve issues but also support ongoing improvements. Our software keeps you on top of your operational goals by turning your data into actionable insights. The key to smooth terminal management is a proactive approach. When you’re controlling your data, your operation is more likely to run like a well oiled machine.
Leveraging real-world challenges and customer feedback
Kaleris values customer feedback, prioritizing suggestions by the significance of their potential impact. We carefully evaluate all input, implementing only the most effective ideas, keeping both Kaleris and its terminals ahead of the game. Additionally, real-world use cases and operational challenges help our team assess needs and add value, guiding the development of effective solutions.
By listening to our customers and combining their feedback with our own product insights, we’re excited to highlight the new features in our latest Analytics release, version 1.4.3, built with your needs in mind.
Here are two significant enhancements based on such evaluated feedback:
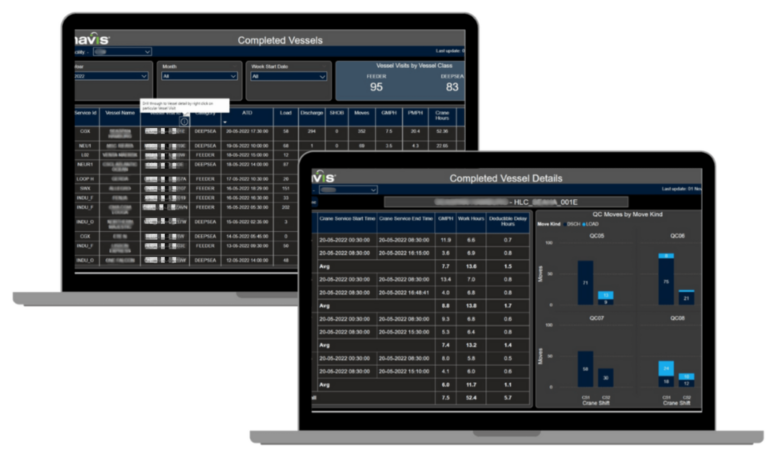
1. Crane Shift Reports
Analytics 1.4.3 introduces the ability to generate reports on crane shifts and existing work shift reports. Our customers can now view a consolidated list of vessels, their respective moves, delays, work hours, and productivity metrics like Gross Moves Per Hour (GMPH), Port Moves Per Hour (PMPH). Detailed reports with graphs are available for better visibility at the crane level.
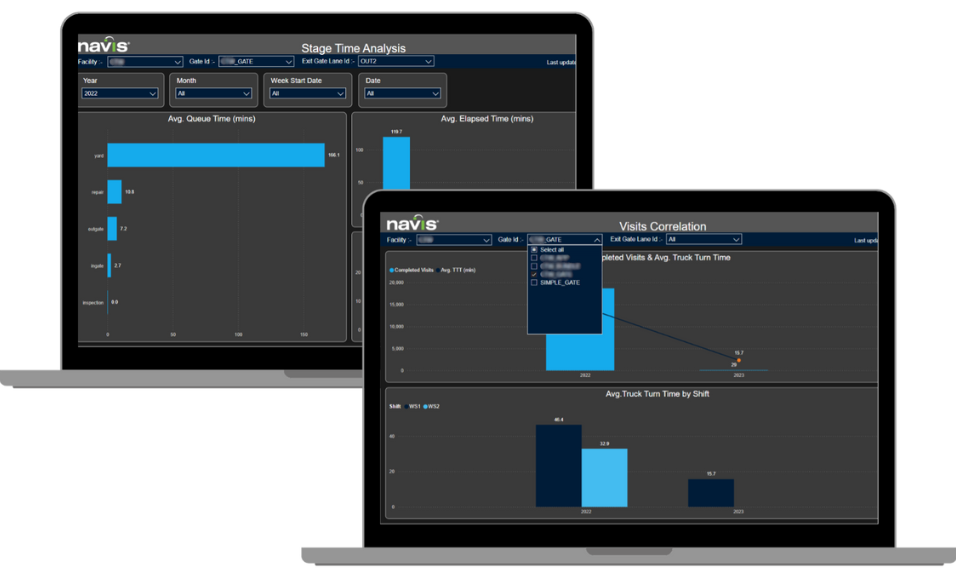
2. Gate ID and Gate Lane ID Enhancements
Another major enhancement is the inclusion of Gate ID and Gate Lane ID in existing truck visit KPIs. This feature provides visibility into the time taken to move a truck through a lane at the gate, enabling operations personnel to quickly identify and troubleshoot bottlenecks, reducing wait times at the gates.
Advancements in OpsView and Analytics have delivered significant, tangible improvements when it comes to helping operations managers manage the reins of their operations. Kaleris partners with our customers to give them in-depth operational insights, enhanced foresight and the momentum to make informed decisions.
Contact us to learn more about how OpsView and Analytics can help transform your business.
About OpsView and Analytics
OpsView and Analytics, as part of our Execution and Visibility Platform (EVP) help your ports and terminals with-
- Data-driven decisions
- Achieving and scaling operational productivity
- Optimizing resources to reduce costs
- Minimizing penalties with timely departure of vessels and trains, all while safeguarding your data in an easily retrievable format
- Seamless updates as it is decoupled from the N4 TOS
Learn more about Kaleris OpsView & Analytics
